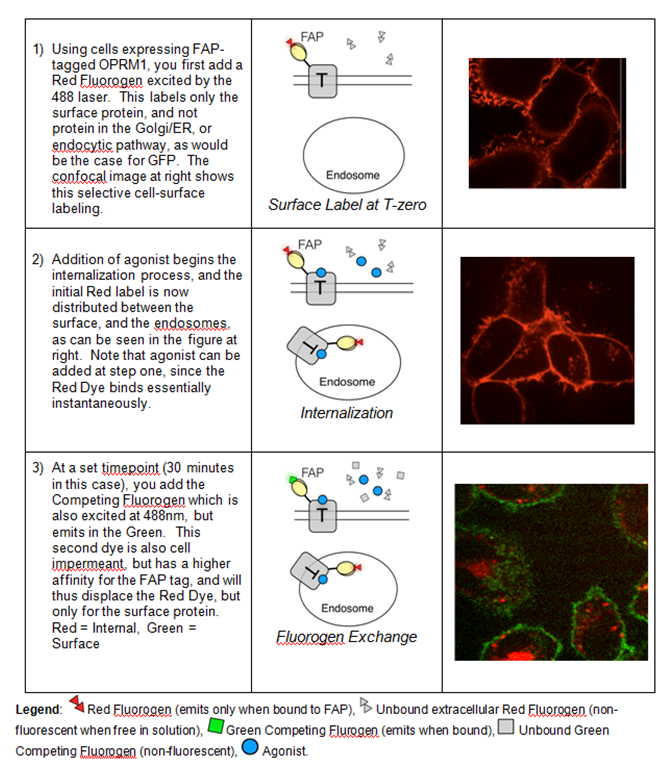
OPRM1 also known as the Mu Opioid Receptor (MOR) and shows a high affinity for enkephalins and beta-endorphin (http://en.wikipedia.org/wiki/%CE%9C-opioid_receptor). Morphine is a strong agonist to ORPM1 as are many other pain medications. SpectraGenetics has developed a 2 color assay that directly measures SSTR2 internalization, trafficking, and recycling of the receptor back to the cell membrane using fluorogen activating peptide technology.
Fluorogen Activating Peptide (FAP) technology combines a genetic tag (to tag the target GPCR), and a fluorogenic dye that only gives signal when bound to the tag.
Using the FAP and cell-impermeant dyes you can selectively label cell-surface and endocytosed protein pools in the following wash-free protocol.
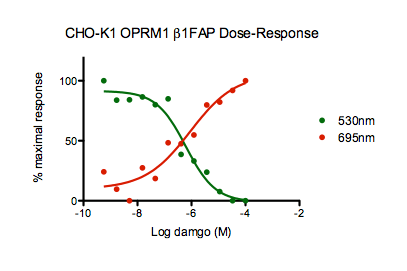
While the confocal images above confirm that the localization of the Green and Red signal to surface and endocytic pools respectively, the signal produced in the assay is homogeneous, so imaging is not required. The plots below show the assay run on a BD FACS-Vantage cytometer, and are plots of the average fluorescence intensity from the red and green channels from 10,000 events per data point.
The graph shows dose response of the receptor agonist DAMGO. Increasing concentrations of agonist move the cells from predominantly surface GPCR localization (labeled in Green after the color-exchange), to predominantly endocytosed GPCR (the Red fluorogen, protected from exchange within the endosome).
While it is possible to simply measure an increase in the Red channel to follow agonist-driven endocytosis, measuring the Green channel simultaneously allows you to take the Red/Green ratio or Green-Red difference to obtain a larger assay window.
The same assay can be used to measure antagonist response or to see internalized receptor return to the surface (re-sensitization).
The following products were used to obtain the data in this report:
|
Product Name |
Catalog |
Amount |
# Wells |
Price |
|
βGREEN fluorogen |
βGREEN-np-010 |
20 nmol |
1,000 |
$999 |
|
βRED fluorogen |
βRED-np-010 |
20 nmol |
1,000 |
$1,499 |
|
OPRM1-FAPβ1- CHOK1 Cell Line |
OPRM1-FAPβ1-CL2 |
2 vials |
n/a |
$7,450 |
|
OPRM1-FAPβ1-U937 Cell Line |
OPRM1-FAPβ1-CL1 |
2 vials |
n/a |
$7,450 |
SpectraGenetics has tagged more than 150 GPCRs and has validated more than 30 GPCR cell lines.
We also offer this assay as a service through our partner Sharp Edge Labs (www.sharpedgelabs.com).
This data set is available as a pdf.


